Why Order Flow Matters in Today’s Markets
Order flow analysis has become a cornerstone of modern trading. Unlike traditional technical analysis, which focuses on historical price patterns, order flow delves into the actual buy and sell orders driving the market. This approach allows traders to see the forces behind price movements, providing a more precise view of supply, demand, and liquidity.
The concept of order flow trading dates back to tape reading in the early 20th century, when traders manually observed transactions on ticker tapes to predict price movements. With technological advancements, this method has evolved into sophisticated digital order book analysis used by institutional traders and high-frequency trading (HFT) firms. Today, both stock and forex markets rely heavily on order flow data, with platforms like Bookmap, Sierra Chart, and ATAS providing real-time visualization of market dynamics.
Order flow is crucial for traders who want to:
- Anticipate market moves before they appear in traditional charts
- Identify hidden liquidity that may not be visible in price patterns
- React to institutional activity, including iceberg orders and HFT strategies
In this blog, we’ll explore key order flow techniques, tools, real-world case studies, risks, and future trends, offering a comprehensive guide for both retail and professional traders.
Importance of Order Flow in Stock and Forex Markets
1. Market Microstructure Understanding
Order flow analysis gives insight into market microstructure, which is the framework that defines how orders are executed and prices are formed. Traders who understand microstructure can anticipate short-term price movements and adjust strategies accordingly.
For example, in the stock market, observing a cluster of buy orders at a specific price can indicate strong support, while a sudden removal of sell orders may signal impending price spikes. Similarly, in the forex market, order flow helps traders understand liquidity dynamics in major currency pairs like EUR/USD and GBP/USD, where central bank actions and institutional trades can trigger rapid moves.
2. Supply and Demand Imbalances
Price reacts to imbalances between buyers and sellers. When large buy orders outweigh sell orders, prices rise; when sell orders dominate, prices fall. Order flow analysis allows traders to identify liquidity zones, where significant volumes are concentrated, and predict price behavior more accurately than using candlestick patterns alone.
For instance, during the forex market open in London, liquidity surges as institutional banks place large orders. Retail traders who observe order flow can position themselves to benefit from price spikes in major pairs like USD/JPY or EUR/GBP.
3. Price Follows Liquidity
Liquidity is the engine of market movement. Large orders can move prices temporarily, while thinly traded markets are more volatile. By tracking the depth and speed of orders, traders gain insights into potential breakout points or reversals.
Example: If a major institutional order is absorbed without moving the price, it may indicate hidden buying strength, signaling a potential bullish breakout.
4. Strategic Edge for Traders
Order flow analysis provides a tangible advantage over traditional chart-based trading. By understanding the behavior of smart money vs retail traders, professionals can anticipate market reactions and avoid getting caught on the wrong side of trades.
Key Techniques for Tracking Order Flow
Traders use various techniques to interpret order flow effectively. Combining multiple approaches enhances accuracy.
1. Tape Reading (Time and Sales)
Tape reading displays each executed order in real-time, showing price, volume, and speed. Traders analyze the frequency and size of trades to gauge buying or selling pressure.
Example: A sudden surge of small buy orders at a specific price may indicate retail enthusiasm, whereas a large block order suggests institutional involvement.
2. Volume Delta
Volume delta compares aggressive buying vs selling volume at each price level. Positive delta indicates dominance of buyers; negative delta reflects selling pressure.
Example: If EUR/USD shows a strong positive delta at 1.1030, it suggests buyers are actively absorbing sell orders, signaling potential upward movement.
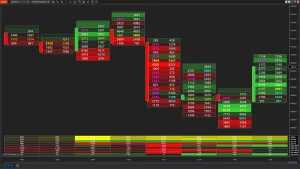
3. Footprint Charts
Footprint charts display bid vs ask volume at each price level. They help traders identify absorption, exhaustion, and significant liquidity clusters.
Example: If a footprint chart shows large sell volume absorbed by buyers at 150.50, a short-term price rise may follow.
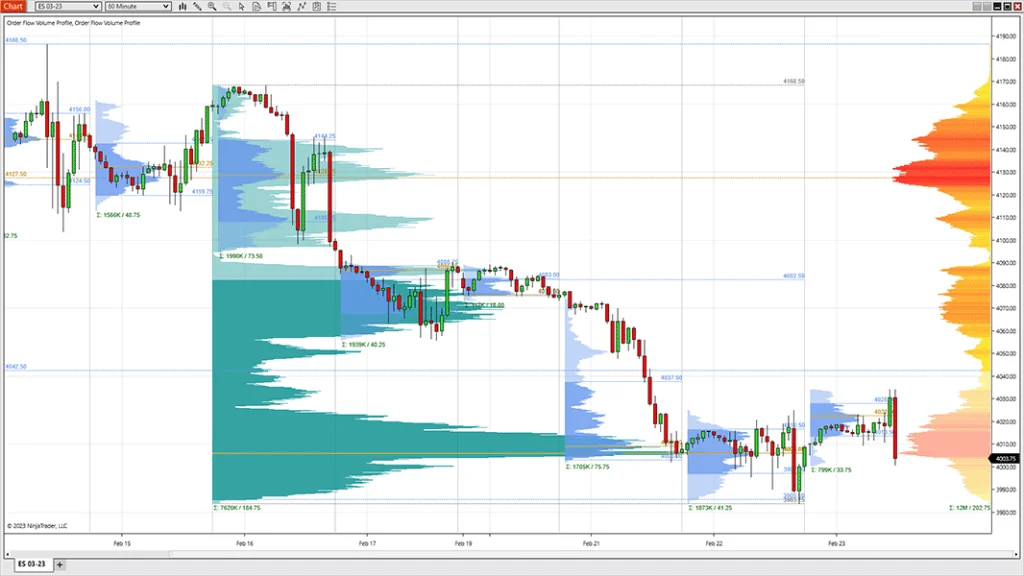
4. Liquidity Heatmaps
Heatmaps visualize order book depth, highlighting areas of high liquidity. Darker zones indicate larger pending orders, helping identify support and resistance levels.
Example: A dark zone at 1.3050 EUR/USD may prevent price from dropping, offering traders a strategic entry point.
5. VWAP and Absorption Analysis
- VWAP (Volume Weighted Average Price): Shows average price weighted by volume. Traders use it as a reference for market trends.
- Absorption Analysis: Tracks whether large orders are being absorbed without price movement, revealing hidden liquidity.
Example: A stock trading below VWAP with high absorption might be preparing for a breakout above the average price.
6. Iceberg Orders and Spoofing Detection
- Iceberg Orders: Large orders split into smaller portions to hide true size.
- Spoofing: Fake orders placed to manipulate price. Detecting these requires careful order flow observation.
Example: A sudden spike in small orders without corresponding price movement may indicate an iceberg order hiding substantial buying or selling.
Tools Used by Professional Traders
Professional traders rely on specialized tools to make sense of complex order flow data.
1. Order Flow Platforms
- Bookmap: Real-time heatmap of order book depth
- Sierra Chart: Footprint charts and volume cluster analysis
- ATAS: Advanced analytics for futures and forex
- NinjaTrader: Integrated order flow analysis with execution
- Quantower: Multi-asset platform with depth visualization
Each platform offers unique features; choice depends on market, trading style, and budget.
2. Broker Data vs Exchange Data
- Retail traders often use aggregated broker data, which may have delays or limited depth.
- Institutions access direct exchange feeds, providing real-time, full-depth data for faster decision-making.
3. Limit Order Book (LOB) Visualization
LOB shows all pending buy and sell orders at each price level, revealing liquidity gaps and potential reversals.
Example: A thinning bid in a stock may signal an imminent downward move, while large sell orders being absorbed may hint at an upward push.
4. APIs and Data Feeds
Professional traders integrate FIX protocols or WebSocket feeds for algorithmic strategies. This enables sub-second execution, crucial in HFT and institutional trading.
Retail vs Institutional Order Flow — Key Differences
| Feature | Retail Traders | Institutional Traders |
| Data Access | Broker feeds (aggregated) | Direct exchange feeds |
| Latency | Moderate | Ultra-low (<1ms) |
| Hidden Liquidity | Rarely visible | Iceberg orders common |
| Market Impact | Minimal | Significant |
| Strategy Focus | Trend following | Predictive, proactive |
Key Insight: Retail traders often react to moves, while institutions create moves. Understanding this dynamic is essential to avoid being trapped on the wrong side of the market.
Case Study — Order Flow in High-Frequency Trading (HFT)
Scenario: Detecting a Liquidity Vacuum
- An HFT firm monitors the limit order book of a highly liquid stock.
- They notice a large bid absorbed at $150.50 without price movement.
- Smaller retail sell orders begin to dominate.
- The HFT system executes rapid buys anticipating a short squeeze as liquidity gaps trigger a price jump.
- Price rises to $151.20 within seconds, capturing profit from micro-moves.
This case demonstrates how real-time order flow data enables rapid decision-making, critical for HFT strategies.
Risks and Limitations of Order Flow Analysis
1. Data Quality and Accuracy
Delayed or incorrect data can mislead traders. Always use reliable data feeds and cross-check signals.
2. Fake Liquidity
Spoofing and layering can create illusory order book depth, leading to false signals.
Mitigation: Look for repeated patterns and confirm signals with volume delta or footprint charts.
3. Over-Reliance on Short-Term Signals
Order flow focuses on microstructure, often neglecting macroeconomic events, news, or market sentiment.
Mitigation: Combine order flow analysis with fundamental research and technical indicators.
4. Psychological Risk
Rapid order flow changes can cause stress and impulsive decisions. Traders must maintain discipline, risk management, and a structured trading plan.
Step-by-Step Guide for Traders Using Order Flow
- Set up a reliable data feed: Choose a platform offering real-time depth and execution data.
- Learn footprint charts: Observe bid vs ask volume at each price level.
- Identify liquidity clusters: Track large orders and hidden volume to predict potential price reversals.
- Develop a simple strategy: For example, buy when large sell orders are absorbed or sell when bids vanish.
- Backtest: Use historical order flow data to validate your strategy.
- Combine with risk management: Always set stop-losses and position size limits.
- Refine over time: Track your performance and adapt to changing market conditions.
Future Trends in Algorithmic Trading and Order Flow
1. AI-Driven Prediction
Machine learning models now analyze patterns in order flow to predict short-term price changes with remarkable accuracy.
2. Deep Learning for LOB Modeling
Traders use neural networks to model the entire limit order book, uncovering complex patterns invisible to humans.
3. Predictive Volume Algorithms
Predictive algorithms anticipate large institutional orders, helping traders position themselves ahead of market moves.
4. Adaptive Execution Strategies
Modern algorithms dynamically adjust execution based on real-time order flow, optimizing TWAP, VWAP, POV, and sniper strategies.
5. Regulatory and Market Challenges
Market fragmentation, cross-asset integration, and stricter regulations will require more advanced tools and smarter algorithms for successful order flow analysis.
Conclusion
Order flow analysis is an essential skill for modern traders and financial institutions. By understanding liquidity, market microstructure, and institutional behavior, traders gain insights that traditional chart analysis cannot provide.
From tape reading origins to AI-driven predictive algorithms, mastering order flow can improve trade timing, risk management, and profitability.
Avesta Consulting provides expert guidance in order flow analysis, algorithmic trading, and market microstructure insights, helping clients navigate complex financial markets with confidence.
Contact Avesta Consulting to optimize your trading strategy, implement advanced order flow analysis, and gain a professional edge in stock and forex markets.