Understanding and optimizing processes is essential for efficiency, cost reduction, and improving customer satisfaction. Process flow analysis helps businesses visualize workflows, identify inefficiencies, and optimize operations for better productivity.
In this guide, we will explore process flow diagrams, identify value-adding and non-value-adding steps, and discuss ways to improve workflows. By the end, you will have a clear understanding of how process flow diagrams (PFDs) can enhance business management and decision-making.
What is a Process Flow Diagram?
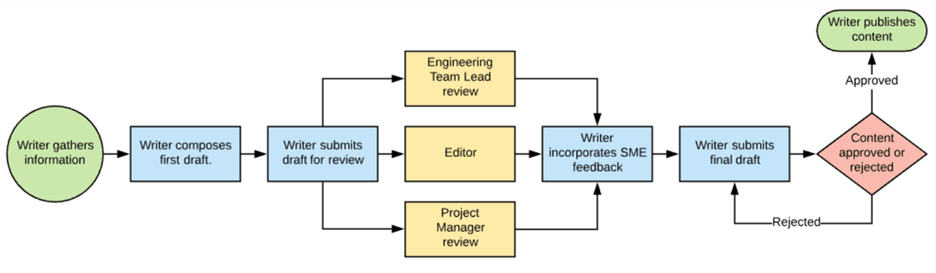
A Process Flow Diagram (PFD) is a visual representation of the steps involved in a process. It uses standardized symbols to illustrate the flow of materials, information, and tasks. PFDs are commonly used in manufacturing, business process management, and software development.
Key Components of a Process Flow Diagram:
- Processes: Represented as rectangles, indicating an action or task.
- Decisions: Shown as diamonds, representing choices in the process.
- Inputs/Outputs: Indicated by parallelograms, representing data or materials.
- Arrows: Show the flow direction from one step to another.
By mapping out processes, organizations can identify inefficiencies, streamline operations, and improve overall workflow performance.
How to Identify Value-Adding Steps?
A value-adding step is any process activity that directly contributes to meeting customer needs or improves the final product/service. These steps increase efficiency, quality, or customer satisfaction.
Characteristics of Value-Adding Steps:
Transforms the product, service, or information for the better.
Directly impacts customer satisfaction.
Cannot be eliminated without reducing quality.
How to Identify Value-Adding Steps?
- Customer Perspective: Ask whether the step is something the customer is willing to pay for.
- Process Mapping: Highlight all actions that contribute to the final product or service.
- Cost-Benefit Analysis: Compare resource consumption with the output value.
Examples:
- A manufacturing process that assembles a product.
- Software testing that ensures product functionality.
- Customer service interaction that resolves an issue.
How to Identify Non-Value-Adding Steps?
Non-value-adding steps are those that consume resources but do not enhance the product, service, or customer experience. These are also known as wasteful activities in Lean methodology.
Types of Non-Value-Adding Steps:
Waiting Time: Delays between steps.
Excess Inventory: Holding more stock than necessary.
Rework & Defects: Correcting errors due to poor quality control.
Overproduction: Producing more than required.
Redundant Approvals: Unnecessary sign-offs that slow down processes.
How to Spot Non-Value-Adding Steps?
- Track the time spent on each step and compare it with actual productive time.
- Identify bottlenecks where processes slow down.
- Analyze employee feedback for unnecessary tasks.
By recognizing these inefficiencies, businesses can eliminate waste and optimize productivity.
How to Eliminate or Minimize Non-Value-Adding Steps?
To enhance process efficiency, organizations must reduce or eliminate wasteful steps without compromising quality.
Strategies to Eliminate Waste:
- Automation: Use technology to handle repetitive tasks.
- Lean Principles: Apply Lean methodologies like 5S (Sort, Set, Shine, Standardize, Sustain).
- Process Standardization: Reduce variations that cause inefficiencies.
- Workflow Optimization: Reorganize tasks to remove bottlenecks.
- Employee Training: Empower staff with skills to execute tasks efficiently.
Example:
A company reducing redundant approvals from five to two steps to speed up decision-making without compromising accuracy.
How to Measure the Value-Adding Ratio?
The Value-Adding Ratio (VAR) is a key performance indicator that measures the percentage of value-added steps in a process.
Formula:
VAR=(Value-Adding TimeTotal Process Time)×100\text{VAR} = \left( \frac{\text{Value-Adding Time}}{\text{Total Process Time}} \right) \times 100
Steps to Measure VAR:
- Identify total process time (value-adding + non-value-adding time).
- Calculate the time spent on value-adding steps only.
- Apply the formula to determine the percentage.
Example:
If a process takes 10 hours and only 6 hours are value-adding, the VAR is:
(6/10)×100=60%(6/10) \times 100 = 60\%
A higher VAR means a more efficient process. The goal is to maximize the value-adding percentage.
How Do We Use Process Flow Diagrams in Qflow?
Qflow is a workflow automation tool that enhances business efficiency using process flow diagrams.
How Qflow Uses PFDs:
Digitizes workflows to automate repetitive tasks.
Visualizes process inefficiencies for easy optimization.
Integrates with multiple platforms to streamline operations.
Example:
An HR department using Qflow can automate leave request approvals, reducing manual intervention and improving turnaround time.
By implementing Process Flow Diagrams (PFDs) in Qflow, businesses can achieve better efficiency and data-driven decision-making.
How Does a Process Flow Chart Benefit Business Management?
Process Flow Charts provide numerous business benefits, including:
- Increased Efficiency
By identifying and removing bottlenecks, businesses can streamline workflows for better productivity.
- Improved Communication
Flowcharts create clear documentation for employees, reducing misunderstandings.
- Enhanced Decision-Making
Managers can analyze processes visually and make informed decisions.
- Standardization
Flowcharts help in standardizing procedures, ensuring consistency across teams.
- Cost Reduction
By removing non-value-adding steps, businesses cut operational costs and maximize profit.
Best Practices for Process Flow Chart
To maximize the effectiveness of process flow charts, follow these best practices:
- Keep It Simple & Clear
Avoid overly complex diagrams—use concise and clear symbols.
- Use Standardized Symbols
Follow industry standards (ISO 5807, ANSI) for easy understanding.
- Validate with Stakeholders
Involve process owners in designing the flowchart for accuracy.
- Regularly Review & Update
Processes evolve—update flowcharts to reflect changes.
- Leverage Technology
Use tools like Microsoft Visio, Lucidchart, or Qflow for digital process mapping.
Final Thoughts
Process Flow Analysis is essential for identifying inefficiencies and optimizing workflows. By leveraging Process Flow Diagrams, businesses can enhance efficiency, reduce costs, and improve decision-making.
By applying the best practices and leveraging automation tools , companies can stay competitive, agile, and continuously improve their operations.