Fatigue is one of the most common causes of failure in engineering components and industrial equipment.
A structure may safely support a load once. However, the same structure can fail when that load is repeated thousands or millions of times.
This type of failure can occur even when the maximum applied stress remains below the material’s yield strength or ultimate tensile strength.
Engineers generally divide fatigue behaviour into two main categories:
- High Cycle Fatigue, commonly called HCF
- Low Cycle Fatigue, commonly called LCF
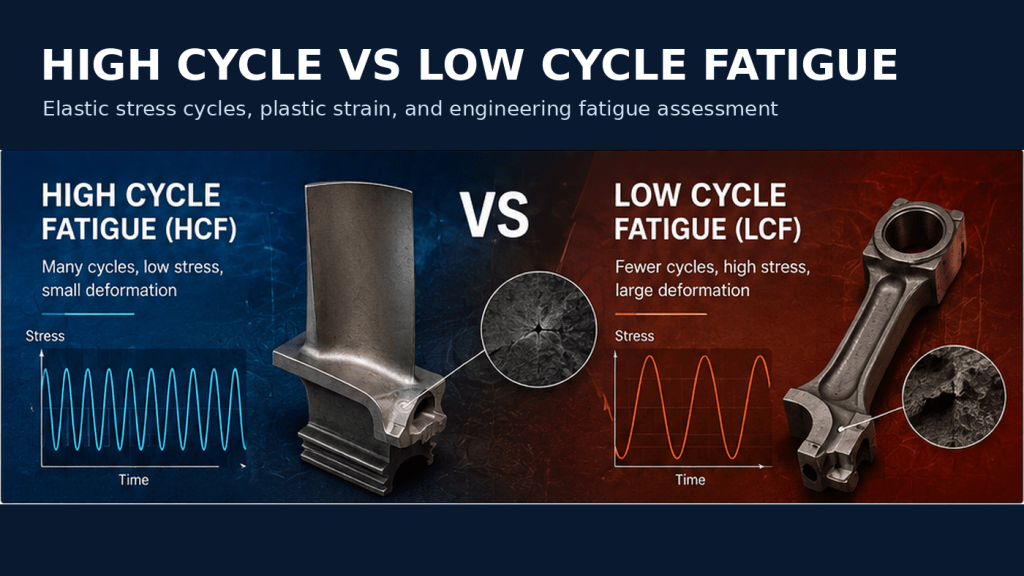
High Cycle Fatigue usually involves a large number of cycles and mainly elastic material behaviour.
Low Cycle Fatigue usually involves fewer cycles and significant plastic deformation at critical locations.
This distinction affects the entire engineering assessment. It determines the required material data, simulation method, fatigue model, and interpretation of the results.
However, the boundary between HCF and LCF is not defined by one universal number of cycles.
The most important factor is the local material response.
If the critical region remains mainly elastic, a stress-life method may be suitable. If repeated plastic deformation occurs, engineers normally require a strain-life method.
This article explains the differences between High Cycle and Low Cycle Fatigue. It also covers their causes, failure mechanisms, industrial applications, assessment methods, and common engineering mistakes.
What Is Fatigue Failure?
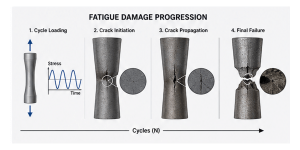
Fatigue failure is progressive material damage caused by repeated or fluctuating loading.
The load may be mechanical, thermal, pressure-based, vibration-induced, or a combination of several operating conditions.
Each cycle may cause only a very small amount of damage. At first, this damage may be microscopic and impossible to identify during a standard visual inspection.
However, the damage accumulates as the number of cycles increases.
Eventually, a small fatigue crack may form at a weak or highly stressed location. The crack then grows as cyclic loading continues.
Once the crack reaches a critical size, the remaining material can no longer support the applied load. Final fracture may then occur suddenly.
A typical fatigue failure develops through three main stages:
- Crack initiation
- Stable crack propagation
- Final fracture
Crack initiation commonly begins at a local stress concentration.
Typical initiation locations include:
- Weld toes
- Weld roots
- Bolt holes
- Thread roots
- Keyways
- Sharp corners
- Surface scratches
- Corrosion pits
- Machining marks
- Material inclusions
- Sudden changes in thickness
- Contact or fretting locations
The final fracture may occur with little visible warning.
Therefore, a component can appear acceptable shortly before complete failure.
Fatigue differs from a simple overload failure.
An overload failure occurs when one applied load exceeds the available structural strength. Fatigue failure develops because repeated loads cause cumulative damage over time.
Understanding Cyclic Loading
Cyclic loading occurs when the stress, strain, force, pressure, temperature, or displacement in a component changes repeatedly.
The load does not need to reverse completely from tension to compression.
For example, a pressure vessel may repeatedly move between low and high internal pressure.
A rotating shaft may experience alternating bending stress during every revolution.
A conveyor support may vibrate while the equipment operates.
A furnace component may expand and contract during heating and cooling.
Each of these conditions creates cyclic loading.
A basic stress cycle can be described using several parameters:
- Maximum stress
- Minimum stress
- Stress range
- Stress amplitude
- Mean stress
- Stress ratio
The stress range is the difference between the maximum and minimum stress.
The stress amplitude is normally half of the stress range for a regular loading cycle.
Mean stress is the average of the maximum and minimum stress values.
The stress ratio compares the minimum stress with the maximum stress.
These quantities directly affect fatigue performance.
Two loading cycles with the same stress range may produce different fatigue lives if their mean stresses are different.
A tensile mean stress usually reduces fatigue life because it keeps the crack open during more of the loading cycle.
A compressive mean stress may improve fatigue resistance in certain materials and operating conditions.
Stress Cycles and Material Response
A material responds to cyclic loading through elastic deformation, plastic deformation, or a combination of both.
Elastic deformation is recoverable.
When the load is removed, the component returns close to its original shape.
Plastic deformation is permanent.
After the load is removed, some strain remains in the material.
This difference is central to understanding High Cycle vs Low Cycle Fatigue.
In High Cycle Fatigue, nominal and local stresses normally remain low enough for the material response to be mainly elastic.
The component may survive hundreds of thousands or millions of cycles before failure.
In Low Cycle Fatigue, the strain range is high enough to cause repeated local plastic deformation.
Each cycle produces more damage. Therefore, failure occurs after fewer cycles.
The local response is often more important than the nominal stress.
A structure may appear elastic when engineers consider only its average stress. However, a notch, weld, hole, or thickness transition can produce local yielding.
For this reason, fatigue engineers must evaluate the critical location rather than relying only on nominal stress values.
Why Repeated Loads Cause Damage
Engineering materials contain microscopic imperfections.
These may include:
- Dislocations
- Inclusions
- Voids
- Grain boundaries
- Surface defects
- Welding imperfections
- Manufacturing marks
Repeated loading causes local movement within the material’s microstructure.
Over many cycles, this movement can create persistent slip bands and microscopic cracks.
Fatigue damage often begins at the surface because the surface may contain machining marks, corrosion, wear, scratches, and environmental damage.
Stress concentrations increase the local damage further.
Once a small crack forms, the stress at the crack tip becomes much higher than the surrounding nominal stress.
The crack may then extend slightly during each damaging load cycle.
Crack growth can remain slow during the early stages.
However, the growth rate usually increases as the crack becomes longer.
Eventually, the crack reaches a critical size and final failure occurs.
Several conditions can accelerate fatigue damage:
- High stress or strain range
- Tensile mean stress
- Surface roughness
- Corrosion
- High operating temperature
- Low-temperature embrittlement
- Residual tensile stress
- Poor weld geometry
- Shaft misalignment
- Structural resonance
- Variable-amplitude loading
- Manufacturing defects
- Fretting contact
A professional fatigue assessment should consider all relevant factors.
What Is High Cycle Fatigue?
High Cycle Fatigue is fatigue failure that develops under a large number of repeated cycles.
The material response remains mainly elastic during each cycle.
Therefore, stress is generally the primary damage parameter.
Engineers usually evaluate HCF using the stress-life method.
This method relates cyclic stress amplitude to the expected number of cycles before failure.
The relationship is shown using an S–N curve.
The letter S represents cyclic stress.
The letter N represents the number of cycles to failure.
High Cycle Fatigue is often associated with fatigue lives above tens of thousands of cycles.
However, the exact transition depends on the material, temperature, geometry, loading history, and local stress concentration.
Engineers should not classify fatigue only by cycle count.
A component that fails after 50,000 cycles may still experience significant local plasticity.
In that situation, a strain-life assessment may provide more reliable results.
Characteristics of High Cycle Fatigue
High Cycle Fatigue has several common characteristics.
Mainly Elastic Material Response
The component experiences little or no permanent deformation during each cycle.
The local stress normally remains below the cyclic yield condition.
Large Number of Cycles
Failure develops after many repetitions.
The total number may range from thousands to millions or even billions of cycles.
Lower Stress Amplitude
Each individual load cycle may appear harmless.
Damage develops because the load repeats continuously.
Sensitivity to Stress Concentrations
Small geometric details can significantly reduce HCF life.
A weld toe, keyway, thread, notch, or hole can raise the local stress range.
Strong Surface Influence
HCF cracks often begin at the material surface.
Surface finish, corrosion, grinding, fretting, and residual stress can strongly influence fatigue life.
Limited Visible Warning
The component may show little deformation before final failure.
A fatigue crack can continue growing until the remaining section fractures suddenly.
Typical Causes of High Cycle Fatigue
HCF commonly results from vibration or repeated operating loads.
Typical causes include:
- Rotating imbalance
- Shaft misalignment
- Gear mesh forces
- Pump pulsation
- Fan vibration
- Flow-induced vibration
- Structural resonance
- Repeated vehicle loading
- Wind loading
- Wave loading
- Pressure fluctuations
- Conveyor vibration
- Frequent thermal cycles
- Poor weld detailing
- Surface imperfections
- Fretting contact
High Cycle Fatigue may also occur when the real number of operating cycles is much greater than the original design assumption.
For example, equipment may operate for more hours each year than initially expected.
A plant upgrade may also increase speed, pressure, throughput, or vibration.
These changes can reduce fatigue life, even when the maximum operating load still appears acceptable.
Common Engineering Examples of HCF
Rotating Shafts
A rotating shaft under bending may experience one complete stress cycle during every revolution.
At high rotational speeds, the shaft can accumulate millions of cycles within a relatively short period.
Cracks often start near keyways, shoulders, fillets, threads, or surface damage.
Fans and Impellers
Fan blades and impellers experience aerodynamic forces, centrifugal stress, and vibration.
If an excitation frequency approaches a natural frequency, resonance can greatly increase the stress amplitude.
This can produce rapid HCF damage.
Welded Structures
Conveyor frames, platforms, bridges, mining structures, and industrial supports may experience relatively small repeated stress ranges.
Fatigue cracks commonly begin at weld toes, weld roots, attachments, or poor geometric transitions.
Bearings and Gears
Bearings and gears experience repeated contact stress.
Over time, this loading can cause surface or subsurface fatigue damage, including pitting and spalling.
Pipelines
Pressure fluctuations and flow-induced vibration can create High Cycle Fatigue.
Small-bore connections are especially vulnerable because they may experience significant vibration.
Bridges and Infrastructure
Traffic, wind, machinery, and repeated structural movement can create millions of cycles throughout the service life of a bridge or civil structure.
What Is Low Cycle Fatigue?
Low Cycle Fatigue occurs when repeated loading causes significant cyclic plastic strain.
The component experiences fewer cycles than in a typical HCF condition.
However, each cycle causes more damage.
LCF is commonly associated with severe mechanical loading, thermal cycling, start-up and shutdown events, pressure transients, or large structural movements.
Engineers normally evaluate Low Cycle Fatigue using the strain-life method.
This method relates strain amplitude to the expected number of reversals or cycles before fatigue crack initiation.
The strain-life curve is also called an ε–N curve.
The symbol ε represents strain.
The symbol N represents fatigue life.
Strain-life methods separate the total strain into elastic and plastic components.
This distinction is important because plastic strain can dominate the damage during severe cyclic loading.
Characteristics of Low Cycle Fatigue
Significant Plastic Strain
The critical region yields during each severe load cycle.
This plastic deformation may remain local and may not be visible across the entire component.
Lower Number of Cycles
Failure may occur after dozens, hundreds, thousands, or tens of thousands of severe cycles.
The exact cycle range depends on the material response and loading conditions.
High Stress or Strain Range
The loading produces significant local strain.
The nominal stress may exceed yield, or a local stress concentration may cause plastic deformation.
Hysteresis Behaviour
During a complete loading and unloading cycle, the stress-strain response may form a hysteresis loop.
The area inside this loop represents energy dissipated through plastic deformation.
Cyclic Hardening or Softening
Some materials become stronger during repeated plastic cycling.
Other materials gradually become softer.
This behaviour can change the stress response and fatigue life.
Strong Temperature Influence
Many LCF problems involve elevated temperature and thermal cycling.
Material stiffness, yield strength, fatigue resistance, and creep behaviour may change during operation.
Typical Causes of Low Cycle Fatigue
Low Cycle Fatigue normally results from severe but less frequent operating events.
Common causes include:
- Plant start-ups and shutdowns
- Large temperature gradients
- Pressure transients
- Emergency shutdowns
- Seismic events
- Severe mechanical overload cycles
- Repeated local yielding
- Thermal shock
- Large displacement cycling
- Creep-fatigue interaction
- Plastic strain around welds
- Expansion and contraction restraints
LCF commonly occurs when equipment repeatedly moves between cold and hot operating conditions.
Different parts of the component may heat or cool at different rates.
This creates thermal expansion differences, thermal strain, and local yielding.
The process repeats during cooling.
As a result, fatigue cracks may develop even when the external mechanical force is relatively small.
Common Engineering Examples of LCF
Pressure Vessel Nozzles
Pressure and temperature cycles can create significant local strain around nozzle intersections.
Start-up and shutdown events may control the fatigue life.
Furnace and Boiler Components
Rapid heating and cooling create thermal gradients.
Headers, tubes, supports, attachments, and shell connections may experience Low Cycle Fatigue.
Gas Turbine Components
Turbine discs, blades, rotors, and casings experience severe thermal and mechanical cycles.
The number and severity of start-up and shutdown events can strongly affect fatigue life.
Engine Components
Pistons, cylinder heads, exhaust manifolds, and other engine parts experience repeated thermal-mechanical loading.
Power Plant Equipment
Thick pressure components may experience large thermal stresses during heating, cooling, and operating transients.
Seismic-Resistant Structures
A major seismic event may cause repeated inelastic structural deformation.
Even a relatively small number of severe cycles can produce LCF damage.
High Cycle vs Low Cycle Fatigue: Key Differences
High Cycle Fatigue and Low Cycle Fatigue both involve progressive damage under repeated loading.
However, their loading severity, material response, and assessment methods differ.
Number of Cycles
HCF generally occurs after a large number of cycles.
LCF generally occurs after a smaller number of cycles.
However, no universal cycle count defines the boundary for every application.
Some references use approximately 10,000 cycles as a general transition.
Other references use approximately 100,000 cycles.
These values should only be treated as broad guidelines.
The more important question is whether the material at the critical location behaves elastically or plastically.
Stress Levels
HCF normally involves lower stress amplitudes.
The material response remains mainly elastic.
LCF involves higher stress or strain ranges.
Local yielding occurs during damaging cycles.
A high nominal stress does not always confirm LCF.
Similarly, a low nominal stress does not always confirm HCF.
Local stress concentrations can cause plastic deformation even when the nominal stress appears moderate.
Deformation Behaviour
HCF produces mainly elastic deformation.
The component returns close to its original shape after the load is removed.
LCF produces a combination of elastic and plastic deformation.
Some permanent local strain develops during cycling.
Visible global deformation may still be absent.
Therefore, a component can experience LCF even when it does not appear permanently distorted.
Failure Mechanisms
HCF damage often begins through microscopic slip and crack initiation at a surface imperfection.
A large percentage of the total fatigue life may be spent initiating the crack.
The crack then grows until final fracture occurs.
LCF damage is strongly related to repeated plastic strain.
Cracks may form earlier because each cycle causes more severe local material damage.
Thermal fatigue, cyclic plasticity, and creep may also contribute.
Both fatigue types eventually involve crack initiation and propagation.
The main difference is the severity and nature of the cyclic response.
High Cycle vs Low Cycle Fatigue Comparison Table
| Comparison Area | High Cycle Fatigue | Low Cycle Fatigue |
|---|---|---|
| Common abbreviation | HCF | LCF |
| Typical cycle range | Large number of cycles | Lower number of cycles |
| Material response | Mainly elastic | Elastic-plastic |
| Main damage parameter | Stress amplitude | Strain amplitude |
| Common assessment method | Stress-life or S–N | Strain-life or ε–N |
| Typical loads | Vibration and repeated operating loads | Severe mechanical or thermal cycles |
| Local yielding | Usually limited | Significant at critical locations |
| Visible deformation | Usually absent | May remain local and difficult to observe |
| Common material data | S–N curves | Cyclic stress-strain and ε–N curves |
| Typical examples | Shafts, fans, bridges, welded structures | Vessels, turbines, furnaces, thermal cycling |
| Common FEA approach | Linear elastic stress analysis | Elastic-plastic or corrected local strain analysis |
| Major risk | Millions of unnoticed cycles | High damage during each operating event |
Common Industries Affected by HCF and LCF
Both High Cycle and Low Cycle Fatigue affect most asset-intensive industries.
The controlling fatigue type depends on the operating conditions and equipment duty.
Oil and Gas
Oil and gas equipment experiences pressure fluctuations, vibration, temperature changes, corrosion, and environmental loading.
High Cycle Fatigue may affect:
- Compressors
- Pumps
- Fans
- Process piping
- Small-bore connections
- Offshore structures
- Rotating shafts
- Pipe supports
Low Cycle Fatigue may affect:
- Pressure vessel nozzles
- Reactors
- High-temperature piping
- Start-up and shutdown systems
- Expansion joints
- Furnaces
- Process heaters
Corrosion can accelerate both HCF and LCF.
The fatigue assessment should therefore consider the service environment, material condition, and inspection history.
Mining Equipment
Mining equipment operates under vibration, impact, variable payloads, abrasion, and severe operating conditions.
HCF is common in:
- Vibrating screens
- Conveyor structures
- Crusher frames
- Rotating shafts
- Fans
- Equipment supports
- Welded platforms
LCF may occur during:
- Severe impact cycles
- Bucket loading
- Large boom movements
- Repeated overload events
- Local plastic deformation
- Emergency stops
Mining fatigue assessments should use realistic operating data.
The actual duty cycle may differ significantly from the original design assumptions.
Pressure Vessels
Pressure vessels experience cyclic pressure, temperature, external piping loads, and thermal expansion.
HCF may result from frequent small pressure fluctuations or vibration.
LCF may result from major start-ups, shutdowns, thermal transients, or pressure changes.
Critical fatigue locations include:
- Nozzle intersections
- Welded joints
- Supports
- Attachments
- Thickness transitions
- Bolted closures
- Local repairs
Pressure vessel standards may require a fatigue assessment when cyclic service is significant.
The chosen method depends on the vessel design, operating history, material, and applicable code.
Rotating Machinery
Rotating machinery can accumulate cycles extremely quickly.
A machine operating at 1,500 revolutions per minute completes 90,000 revolutions every hour.
Therefore, even small cyclic stresses can become important.
HCF commonly affects:
- Shafts
- Rotors
- Blades
- Couplings
- Gears
- Impellers
- Fans
LCF may affect rotating machinery during start-stop cycles, thermal transients, overspeed events, emergency stops, or severe torque reversals.
A complete assessment may need to evaluate both HCF and LCF.
How Engineers Evaluate HCF and LCF
A fatigue assessment begins with a clear understanding of the operating history.
Engineers must identify the loads, cycle counts, temperatures, pressures, vibration levels, and operating events.
A typical fatigue assessment may include the following steps:
- Define the component and critical locations.
- Collect drawings, operating records, and inspection data.
- Identify cyclic mechanical and thermal loads.
- Calculate local stress and strain histories.
- Determine whether the response is elastic or elastic-plastic.
- Select the appropriate fatigue method.
- Apply suitable material fatigue data.
- Consider mean stress and environmental effects.
- Calculate fatigue life or cumulative damage.
- Compare the result with acceptance criteria.
- Recommend design, inspection, repair, or operating changes.
The quality of the fatigue result depends on the quality of the input information.
A complex fatigue model cannot compensate for an unrealistic loading history.
Stress-Life S–N Methods
The stress-life method is widely used for High Cycle Fatigue.
It uses an S–N curve to relate cyclic stress amplitude to fatigue life.
This method is most suitable when the material response remains mainly elastic.
Engineers calculate the alternating or equivalent stress at the critical location.
They then apply relevant corrections.
These may include:
- Mean stress
- Surface finish
- Component size
- Temperature
- Reliability
- Notch sensitivity
- Weld classification
- Environmental conditions
For welded structures, engineers often use code-based fatigue detail categories.
These categories may already account for typical weld geometry, residual stress, and fabrication quality.
Therefore, applying an additional stress concentration factor without justification may lead to excessive conservatism.
The S–N approach is efficient and widely accepted.
However, it becomes less reliable when significant local plastic deformation occurs.
Strain-Life ε–N Methods
The strain-life method is commonly used for Low Cycle Fatigue.
It relates total strain amplitude to the expected fatigue life.
Total strain includes:
- Elastic strain
- Plastic strain
This allows the method to represent cyclic yielding.
A strain-life assessment may require:
- Cyclic stress-strain data
- Fatigue strength coefficient
- Fatigue strength exponent
- Fatigue ductility coefficient
- Fatigue ductility exponent
- Elastic modulus
- Mean stress correction
The method commonly predicts crack initiation life at a local stress concentration.
Engineers may use an elastic FEA stress result with a local plasticity correction.
Alternatively, they may perform a full elastic-plastic cyclic analysis.
The correct approach depends on the geometry, load severity, operating history, and required level of accuracy.
Variable-Amplitude Loading
Real industrial equipment rarely experiences one constant-amplitude load cycle.
Loads may change with:
- Production rate
- Equipment speed
- Internal pressure
- Temperature
- Operating mode
- Payload
- Environmental conditions
Engineers often use cycle-counting methods to simplify a complex loading history.
Rainflow counting converts a measured or calculated history into individual stress or strain cycles.
The damage caused by each cycle range can then be estimated.
A cumulative damage rule may combine the results.
Miner’s rule is one of the most widely used cumulative damage methods.
However, it is a simplified linear model.
It may not fully represent:
- Load sequence effects
- Overload retardation
- Crack closure
- Interaction between different cycle levels
- Material memory effects
Engineers should understand these limitations when interpreting the result.
Mean Stress Effects
Mean stress can significantly affect fatigue life.
A tensile mean stress generally reduces fatigue resistance.
A compressive mean stress may improve fatigue life in some conditions.
Common HCF mean stress correction methods include:
- Goodman
- Gerber
- Soderberg
Common strain-life correction methods include:
- Morrow
- Smith-Watson-Topper
The most suitable correction depends on the material, loading condition, and available test data.
Mean stress should not be ignored when the cycle is not symmetrical around zero.
FEA-Based Fatigue Assessment
Finite Element Analysis helps engineers calculate local stress and strain in components with complex geometry.
FEA is particularly useful when the component includes:
- Welds
- Holes
- Nozzles
- Fillets
- Contact surfaces
- Multiple load paths
- Thickness changes
- Thermal gradients
- Complex supports
- Bolted joints
For High Cycle Fatigue, engineers often use linear elastic FEA.
The model calculates stress ranges at fatigue-critical locations.
These results are then combined with S–N data.
For Low Cycle Fatigue, the analysis must represent or estimate local plastic strain.
Engineers may use:
- Elastic-plastic material models
- Cyclic stress-strain curves
- Neuber-type corrections
- Local strain methods
- Transient thermal-structural analysis
- Multiaxial fatigue criteria
FEA can also combine several operating loads.
For example, a pressure vessel model may include pressure, external nozzle loads, temperature gradients, self-weight, and thermal expansion.
The fatigue calculation then evaluates the stress or strain range between operating states.
However, FEA does not automatically generate a reliable fatigue life.
The mesh, loads, restraints, material properties, and fatigue data must be reviewed and validated.
Mesh Requirements for Fatigue Analysis
Fatigue results can be highly sensitive to mesh density.
A coarse mesh may underestimate local stress.
An excessively sharp idealised corner may create a mathematical stress singularity.
At a singularity, the calculated peak stress may continue increasing as the mesh becomes finer.
Engineers must determine whether the peak stress represents a real fatigue condition or only a numerical effect.
Mesh refinement should focus on fatigue-critical regions.
A mesh convergence study can show whether the relevant stress value has stabilised.
For welded structures, the required stress extraction method may be defined by a design standard.
Possible approaches include:
- Nominal stress
- Structural hot-spot stress
- Effective notch stress
- Local strain
- Linearised stress
Using the wrong stress result with the wrong fatigue curve can create a serious error.
Common Mistakes in Fatigue Assessment
Fatigue calculations are highly sensitive to assumptions.
Several mistakes occur frequently.
Classifying Fatigue Only by Cycle Count
Cycle count alone does not define whether the condition is HCF or LCF.
The local elastic or plastic response is more important.
Using Stress-Life Data for Plastic Conditions
An S–N method may overestimate fatigue life when significant local yielding occurs.
A strain-life method may be required.
Ignoring Mean Stress
Using only the stress range can miss the effect of tensile mean stress.
Using Nominal Stress at a Local Detail
Nominal stress may not represent the local stress concentration at a weld, hole, notch, or attachment.
Reading Singular FEA Stress Directly
A peak stress at a sharp corner may be mesh-dependent.
Engineers should use an appropriate structural or fatigue stress extraction method.
Applying the Wrong S–N Curve
Smooth specimen curves, welded-detail curves, and code design curves are not interchangeable.
Ignoring Surface Condition
Machining, grinding, corrosion, coating, polishing, and residual stress can change fatigue resistance.
Assuming Constant-Amplitude Loading
Real operating histories normally contain several stress and strain ranges.
Both small frequent cycles and large occasional cycles may contribute to total damage.
Ignoring Temperature Effects
Material fatigue properties and yield behaviour can change significantly at operating temperature.
Ignoring Multiaxial Stress
The direction of the principal stress may change throughout the cycle.
A simple uniaxial fatigue method may not represent this behaviour correctly.
Using Unrealistic Boundary Conditions
Incorrect supports, contacts, or restraints can distort the structural load path.
Failing to Validate the FEA Model
FEA results should be checked using hand calculations, operating measurements, physical testing, or previous equipment behaviour.
Ignoring Existing Cracks
Stress-life and strain-life methods generally focus on crack initiation.
If a significant crack already exists, engineers may need fracture mechanics and crack growth analysis.
Which Fatigue Type Is More Dangerous?
Neither High Cycle Fatigue nor Low Cycle Fatigue is always more dangerous.
The level of risk depends on the component, load history, inspection program, operating environment, and consequences of failure.
High Cycle Fatigue can be dangerous because it develops under normal-looking operating loads.
The component may show no visible plastic deformation.
Millions of cycles can accumulate without a clear warning.
HCF is especially important in rotating machinery, vibrating equipment, welded structures, bridges, and piping systems.
Low Cycle Fatigue can be dangerous because each cycle causes significant damage.
A small number of severe start-ups, shutdowns, thermal shocks, overloads, or pressure transients may consume a large part of the available fatigue life.
LCF is especially important in pressure equipment, turbines, furnaces, boilers, and high-temperature piping.
The most dangerous fatigue condition is often the one that has not been identified.
A design evaluated only for High Cycle Fatigue may overlook cyclic plasticity.
A design evaluated only for major Low Cycle Fatigue events may overlook millions of smaller vibration cycles.
Some components experience both fatigue types.
For example, a turbine may experience LCF damage during start-up and shutdown while also experiencing HCF during steady operation.
Engineers should therefore evaluate the complete operating history.
How to Reduce High Cycle Fatigue Risk
Engineers can reduce HCF risk through several design and maintenance measures:
- Reduce stress concentrations
- Improve weld geometry
- Avoid resonance
- Balance rotating equipment
- Correct shaft misalignment
- Reduce vibration
- Improve surface finish
- Add suitable fillets
- Control corrosion
- Improve inspection access
- Monitor operating cycles
- Use fatigue-resistant materials
- Improve support stiffness
- Eliminate fretting where possible
The best solution often removes the source of the cyclic load.
Simply increasing material thickness may not solve a vibration or resonance problem.
How to Reduce Low Cycle Fatigue Risk
Engineers can reduce LCF risk by:
- Reducing thermal gradients
- Controlling heating rates
- Controlling cooling rates
- Increasing structural flexibility
- Removing severe restraints
- Reducing local plastic strain
- Improving transition geometry
- Selecting materials with suitable ductility
- Limiting pressure transients
- Managing creep-fatigue interaction
- Reducing severe operating events
- Monitoring temperature and strain
Operational procedures can be as important as structural design changes.
For example, a slower heating rate may reduce thermal fatigue more effectively than increasing the wall thickness.
How Avesta Consulting Supports Fatigue Assessment
Fatigue problems often involve several engineering disciplines.
A complete assessment may require structural analysis, vibration data, operating history, material properties, thermal modelling, and fracture mechanics.
Avesta Consulting supports industrial fatigue projects through:
- Stress-life fatigue assessment
- Strain-life fatigue assessment
- Static and dynamic FEA
- Vibration analysis
- Rainflow cycle counting
- Power spectral density methods
- Thermal-structural analysis
- Weld fatigue assessment
- Pressure vessel fatigue assessment
- Remaining life evaluation
- Crack growth analysis
- Design verification
- Root cause failure analysis
- Design modification assessment
The assessment method should match the actual failure mechanism.
For High Cycle Fatigue, this may involve elastic stress ranges and S–N curves.
For Low Cycle Fatigue, it may involve cyclic strain, elastic-plastic material behaviour, and ε–N data.
Some projects require both approaches.
Frequently Asked Questions
What is the main difference between High Cycle and Low Cycle Fatigue?
High Cycle Fatigue involves many cycles and mainly elastic material behaviour.
Low Cycle Fatigue involves fewer cycles and significant cyclic plastic strain.
How many cycles define High Cycle Fatigue?
There is no universal boundary.
Values between approximately 10,000 and 100,000 cycles are often used as general transition guides.
However, engineers should classify the condition based on local material behaviour.
Which method is used for HCF?
The stress-life or S–N method is commonly used.
It is most suitable when the material response remains mainly elastic.
Which method is used for LCF?
The strain-life or ε–N method is commonly used.
It includes both elastic and plastic strain.
Can a component experience both HCF and LCF?
Yes.
A machine may experience Low Cycle Fatigue during start-up and High Cycle Fatigue during steady operation.
The complete assessment should include both operating conditions.
Is thermal fatigue HCF or LCF?
Thermal fatigue can fall into either category.
Large temperature changes often create Low Cycle Fatigue.
Frequent smaller temperature fluctuations may create High Cycle Fatigue.
Can FEA predict fatigue life?
FEA calculates local stress and strain.
Fatigue methods then use these results to estimate damage or fatigue life.
The reliability depends on the load history, mesh, material data, boundary conditions, and modelling assumptions.
Does fatigue occur below yield strength?
Yes.
High Cycle Fatigue can cause failure even when the cyclic stress remains below the material’s yield strength.
Can LCF occur without visible deformation?
Yes.
Plastic strain may be concentrated within a small local region.
The complete structure may not show visible permanent deformation.
What should engineers do when a crack already exists?
An existing crack may require fracture mechanics and crack growth analysis.
A standard fatigue initiation assessment may not be sufficient.
Conclusion
High Cycle Fatigue and Low Cycle Fatigue describe different material responses under repeated loading.
HCF usually involves many cycles, lower stress amplitude, and mainly elastic behaviour.
LCF usually involves fewer cycles, higher strain ranges, and significant local plastic deformation.
This distinction determines the correct fatigue analysis method.
Stress-life S–N methods are commonly used for High Cycle Fatigue.
Strain-life ε–N methods are commonly used for Low Cycle Fatigue.
However, cycle count alone should not control the selection.
Engineers must evaluate the local material response at each critical location.
A reliable fatigue assessment should consider geometry, loading history, mean stress, material properties, temperature, surface condition, weld details, environmental exposure, and inspection findings.
FEA can calculate local stresses and strains within complex industrial equipment.
However, a reliable fatigue result still requires realistic inputs, suitable fatigue data, careful validation, and professional engineering judgement.
Neither HCF nor LCF is automatically more dangerous.
High Cycle Fatigue can cause sudden failure after millions of normal operating cycles.
Low Cycle Fatigue can consume equipment life rapidly during a small number of severe events.
The safest approach is to identify every important cyclic load and apply the correct fatigue assessment method to each operating condition.