A tall stack standing in a steady crosswind looks perfectly still, yet the air passing around it is quietly pushing it from side to side. Most of the time the effect is too small to matter. When it lines up with the structure’s own natural frequency, the movement can grow large enough to crack welds, loosen connections and shorten the life of the equipment. This article explains how vortex shedding analysis works, how it connects to structural resonance and fatigue, and how engineers assess and reduce the risk in industrial stacks, chimneys, silencers and damper blades.
What Is Vortex Shedding?
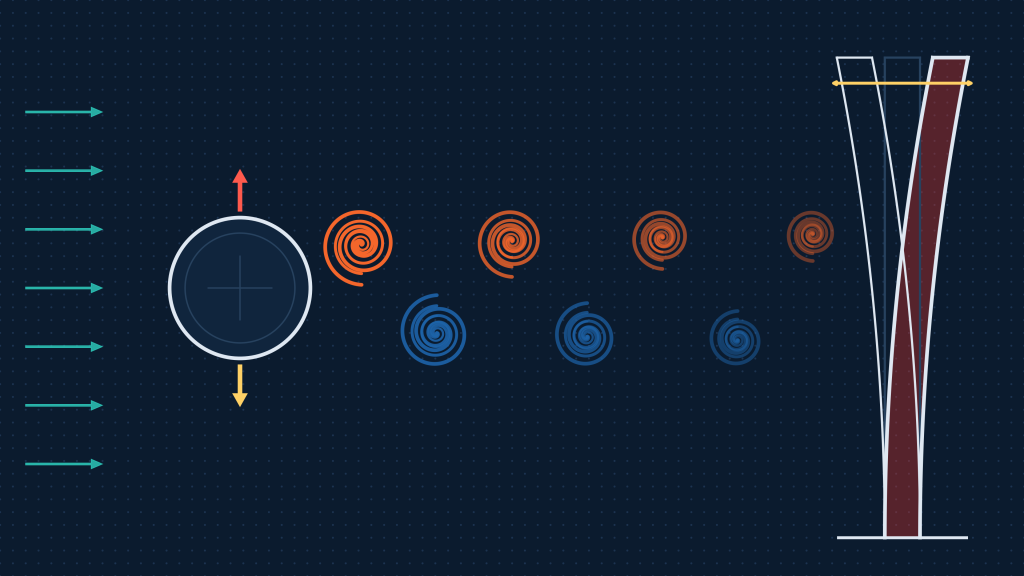
When fluid flows past a bluff (non-streamlined) body such as a cylinder, the flow cannot follow the surface all the way around. It separates, and the shear layers roll up into vortices that peel away from alternate sides of the body. This pattern is known as a von Karman vortex street.
Each time a vortex forms and detaches on one side, it changes the pressure distribution around the body. The result is a fluctuating force, mainly perpendicular to the flow direction (the across-flow or lift direction), with a smaller oscillating component along the flow (drag). Because vortices detach alternately from each side, the lateral force changes direction at a steady rhythm, and that rhythm is the vortex shedding frequency.
For a circular cylinder, the shedding frequency is commonly estimated with the Strouhal relationship:
f = St × U / D
where f is the shedding frequency, U is the flow velocity, D is the characteristic diameter or width, and St is the Strouhal number. For circular cylinders, St is roughly 0.2 across a wide range of Reynolds numbers, but it differs for other shapes, for tapered or ringed stacks, and where neighbouring structures disturb the flow.
Equipment that is susceptible
Any slender structure exposed to cross-flow can be affected. Common examples include:
- Industrial stacks and chimneys, particularly tall, lightly damped steel stacks exposed to wind.
- Exhaust silencers and ducted silencer elements, where internal flow passes around baffles and splitters.
- Damper blades and louvres, which can vibrate when gas flows past partially open blades.
- Pipes, thermowells, heat exchanger tubes and cable or mast structures, wherever a slender element sits in a moving fluid.
The flow can be external (wind) or internal (process gas in a duct). In both cases, the physics is the same: repeating vortex formation creates a repeating load.
If you are concerned about vibration in operating equipment, Avesta’s Vibration & Fatigue Analysis service combines structural dynamics, measurement and fatigue assessment to identify resonance issues and estimate remaining life.
How Vortex Shedding Causes Structural Resonance
Every structure has natural frequencies, the rates at which it prefers to vibrate when disturbed, each with its own mode shape. For a stack, the first bending mode is usually the most important: the whole stack sways like a cantilever beam.
Vortex shedding becomes a problem when two frequencies come close together:
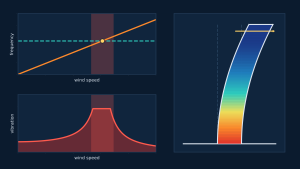
- the vortex shedding frequency, which rises in proportion to flow velocity, and
- a structural natural frequency, which is a property of the stack’s mass, stiffness and boundary conditions.
When the shedding frequency approaches a natural frequency, the periodic force supplies energy to the structure at just the right moment in each cycle. This is resonance. The vibration amplitude is no longer limited by the size of the force alone but by how little energy the structure can dissipate, that is, its damping. Lightly damped structures such as welded steel stacks can respond with amplitudes many times larger than the static deflection from the same force.
Two features make vortex-induced vibration (VIV) more complicated than simple resonance:
- Lock-in. Once the structure starts to vibrate strongly, its motion can influence the vortex formation, so the shedding frequency stays “locked” to the structural frequency over a range of wind speeds rather than only at a single speed. The critical condition therefore covers a band of velocities, not one value.
- Self-limiting amplitude. Unlike some other flow-induced instabilities, VIV amplitudes usually stop growing at a finite level. That level can still be large enough to cause fatigue damage over many cycles.
In ducted equipment such as silencers, shedding can also couple with acoustic resonances of the duct, which may amplify both noise and structural loading. The practical consequences of resonance include excessive sway, cracking at welds and base connections, loosened bolts, damaged internals, and increased noise. Because the vibration is usually modest in amplitude and repetitive, damage tends to accumulate as fatigue and can remain unnoticed until cracks appear.
How to Assess Vortex-Induced Vibration
A sound assessment moves from simple screening to more detailed analysis only as far as the risk requires.
Preliminary calculations and screening
The first step is a hand or spreadsheet check. Engineers estimate the natural frequencies of the structure (from simplified beam models or an initial FEA), calculate the critical flow velocity at which the shedding frequency would match each natural frequency, and compare it with the site wind conditions or the process flow range. Additional parameters are then considered, such as the structure’s damping and mass ratio (often combined in the Scruton number) and the Reynolds number range.
If the critical velocity is far outside the operating range, or the structure is heavy and well damped, the risk may be shown to be low using relevant codes and guidelines. If the critical velocity falls inside the operating range, or the margin is small, the assessment needs to go further.
The role of CFD
Simple formulas assume a standard shape and uniform flow. Real equipment is rarely that simple. Computational fluid dynamics (CFD) is used to evaluate the flow behavior and the resulting oscillating forces when geometry or flow conditions go beyond what simplified methods can represent, for example:
- Tapered stacks, stacks with attachments, or groups of closely spaced structures.
- Silencer baffles, splitters and damper blades with non-circular cross-sections.
- Flow disturbed by upstream equipment, ducts or terrain.
A transient CFD model resolves the vortex formation and extracts the shedding frequency, the Strouhal number for that geometry, and the amplitude of the fluctuating lateral force. That force history becomes the input to the structural model. For a deeper look at when fluid versus structural simulation is the right choice, see our guide to FEA vs CFD.
Structural response with FEA
Once the load is defined, finite element analysis evaluates how the structure responds:
- Modal analysis determines natural frequencies and mode shapes, showing which modes could be excited and where the structure moves most.
- Harmonic response analysis applies the oscillating force at a range of frequencies to determine the peak response, including displacement and stress, when the load is close to a natural frequency.
Damping is one of the most sensitive inputs in this step, so the assumed value should be justified and, where possible, checked with sensitivity runs. The stresses from the harmonic response are the basis for the fatigue assessment that follows.
Comparing with field measurements
Where equipment is already operating, accelerometer measurements provide valuable evidence. Measured vibration spectra show which frequencies are active and how amplitude changes with wind speed or flow rate. Comparing these results with the FEA natural frequencies and the predicted shedding frequencies helps confirm whether resonance is actually occurring and allows the model to be refined. Correlating measurement with virtual testing in this way is central to how Avesta approaches vibration problems. Our article on thermal design validation describes the same principle of correlating predictions with test data.
For complex cases, advanced simulation that links CFD forces to dynamic structural analysis, and then to fatigue assessment, gives the most complete picture.
From Vibration to Fatigue Failure
Vibration at resonance does not usually overload a structure in a single event. The danger comes from repetition. Each vibration cycle creates a small, alternating stress at critical locations, such as weld toes, base plates, nozzle connections and bracket attachments. If those stresses are high enough, microscopic cracks start and slowly grow until the section can no longer carry the load.
Three factors control how quickly this happens:
- Stress amplitude. Fatigue damage rises steeply with stress range, so a modest increase in amplitude can reduce life dramatically. This is why resonance, which raises amplitude, is so damaging.
- Cycle count. Vortex shedding occurs at a frequency that can be a fraction of a hertz to many hertz. A structure vibrating at just 1 Hz accumulates roughly 31 million cycles per year if the vibration is continuous.
- Operating conditions. Fatigue damage accumulates only while the structure is excited. The distribution of wind speeds or flow rates, the temperature, the damping, and the condition of welds and connections (including corrosion or existing flaws) all affect the result.
In practice, high-cycle fatigue assessment uses stress-life (S-N) methods, often with cycle counting such as rainflow to turn a varying stress history into a set of stress ranges, and a damage accumulation rule to estimate life. Where the loading is random, as with turbulent wind, stochastic approaches that work from the response power spectral density are used. These methods are part of Avesta’s fatigue analysis capability, covering stress-life and strain-life assessment, mean stress effects, and deterministic and stochastic damage accumulation for parent material, welds and connection details.
For a wider overview of fatigue methods and the tools we use, read Avesta’s existing article, Fatigue analysis. If cracking has already occurred, a structured investigation such as root cause failure analysis can show whether vibration, thermal loading or a combination is responsible.
How Can Vortex Shedding Risks Be Reduced?
There is no single fix. The right measure depends on what is driving the vibration and what the equipment can tolerate. The main approaches are:
- Change the structural stiffness or mass. Adding stiffness, changing wall thickness, adding bracing or guy supports, or altering the mass distribution shifts the natural frequency away from the shedding frequency range.
- Change the natural frequency in another way. Modified boundary conditions, such as improved base fixity or additional supports, also change the dynamic behavior.
- Increase damping. Tuned mass dampers and other damping devices dissipate vibration energy and reduce the resonant amplitude.
- Modify the aerodynamics. Helical strakes, shrouds or other devices disrupt the regular formation of vortices along the length of a stack. For silencers and damper blades, changes to blade profile, spacing or support arrangement can alter the shedding behavior.
- Limit the exposure. In some cases, operating changes that avoid the critical flow range, or inspection and monitoring regimes, can control the risk where physical modification is not practical.
Each option has trade-offs. Aerodynamic devices can increase drag and wind loading on the structure, added stiffness can raise stresses elsewhere, and dampers need tuning and maintenance. Mitigation should therefore be selected using an engineering assessment of the specific equipment, operating conditions and failure mode, and the effect of the chosen measure should be checked analytically before it is built.
When Is Advanced Simulation Required?
Preliminary calculations are an efficient screening tool, but they may be insufficient when:
- The critical velocity lies within or near the operating range and the margin cannot be justified by simple formulas.
- The geometry is non-standard, such as tapered or multi-section stacks, internal baffles, damper blades, or groups of structures that interfere with each other’s flow.
- There is existing damage such as fatigue cracking, loosened fasteners or visible sway, and the cause is not clear.
- Consequences of failure are high, for example equipment that carries hot gas, supports other structures or is difficult to access for repair.
- A modification is proposed and its effect on vibration must be demonstrated before it is installed.
In these situations, the appropriate tools may include CFD to quantify the fluctuating forces, dynamic structural analysis (modal and harmonic response) to find the response, and fatigue assessment to estimate life. Where the equipment is already in service, field measurements with accelerometers add evidence and allow the models to be checked against reality. Our overview of mechanical engineering simulation explains how these analyses fit together.
These problems arise across power generation, oil and gas, steel and marine facilities, wherever stacks, exhaust systems and gas-handling equipment operate.
Relevant Avesta Projects
Avesta’s projects cover a range of structural, vibration and fatigue assessments. One relevant example for exhaust equipment is the Marine Engine Exhaust Silencer Stress Analysis for IAC Acoustics (Austal Ships, Fremantle, Western Australia).
It is important to describe this project accurately. The silencer had experienced fatigue cracking and permanent deformation (localized buckling) at various locations, and Avesta carried out a root cause failure analysis. The assessment applied dead loads, internal pressure and steady-state and transient thermal loads in combination with different restraint conditions to replicate the observed cracking and buckling. This included a buckling analysis with steady-state temperatures and a quasi-static analysis with transient temperatures, considering nonlinear elastic-plastic material behavior to find the peak stress and strain locations. Avesta determined the restraint conditions most likely to cause the observed buckling and assisted with the development of an alternative silencer design to mitigate the premature fatigue cracking.
This project is a thermal and structural fatigue investigation and is not presented here as an example of vortex shedding. It is included because it shows how fatigue cracking in exhaust equipment is investigated by identifying the loads and restraint conditions that drive it, which is the same discipline needed once vortex-induced vibration is suspected.
Frequently Asked Questions
What causes vortex shedding?
Vortex shedding is caused by flow separation around a bluff body. As fluid passes a structure such as a stack, the boundary layer separates and rolls up into vortices that detach alternately from each side. Each detachment changes the pressure on the structure, producing a fluctuating lateral force at a frequency that increases with flow velocity and decreases with the structure’s width.
How can vortex shedding cause structural fatigue?
The alternating force makes the structure vibrate, and each vibration cycle creates a small alternating stress at critical details such as welds and base connections. When the shedding frequency is close to a natural frequency, resonance increases the stress amplitude, and the high cycle count means damage accumulates quickly. Over time, fatigue cracks can start and grow even though the stresses are well below the yield strength of the material.
When is CFD required for vortex shedding analysis?
CFD is typically required when simplified formulas are not reliable, for example with non-circular or tapered shapes, closely spaced structures, silencer baffles, damper blades, or disturbed or non-uniform flow. It provides the shedding frequency and the magnitude of the fluctuating force, which are then used in a structural dynamic analysis. Where the screening calculation shows a clear margin from resonance, CFD may not be necessary.
How can structural resonance be identified?
Resonance is identified by comparing the structure’s natural frequencies, from modal analysis or measurement, with the frequencies of the exciting force, such as the vortex shedding frequency across the operating range. In the field, accelerometers can show a dominant vibration frequency that coincides with a natural frequency and amplitude that changes sharply with wind speed or flow. Harmonic response analysis then quantifies the resulting stresses.
Talk to Avesta About Vibration, Resonance and Fatigue
If you have a stack, silencer, damper or other equipment that vibrates, has cracked, or is facing a change in operating conditions, Avesta can help you assess the risk. Our team combines CFD, dynamic structural analysis, field measurement and fatigue assessment to give you a clear, defensible answer. Contact Avesta Consulting to discuss your vibration, resonance and fatigue challenges, or explore our Vibration & Fatigue Analysis service.