Mesh Convergence Study in FEA: A Practical Guide to Reliable Results
A mesh convergence study checks whether the result you intend to rely on stops changing meaningfully as the finite element mesh is refined. It estimates discretisation error only. Making the elements smaller does not, by itself, show that a model represents reality, so the monitored result and the engineering purpose need to be defined before the first mesh is built.
This guide is a software-neutral way to plan, evaluate and report a study in structural FEA. It assumes you know the basics, which are covered in our finite element analysis overview. Here the focus is on the evidence a reviewer should expect to see.
What Is a Mesh Convergence Study in FEA?
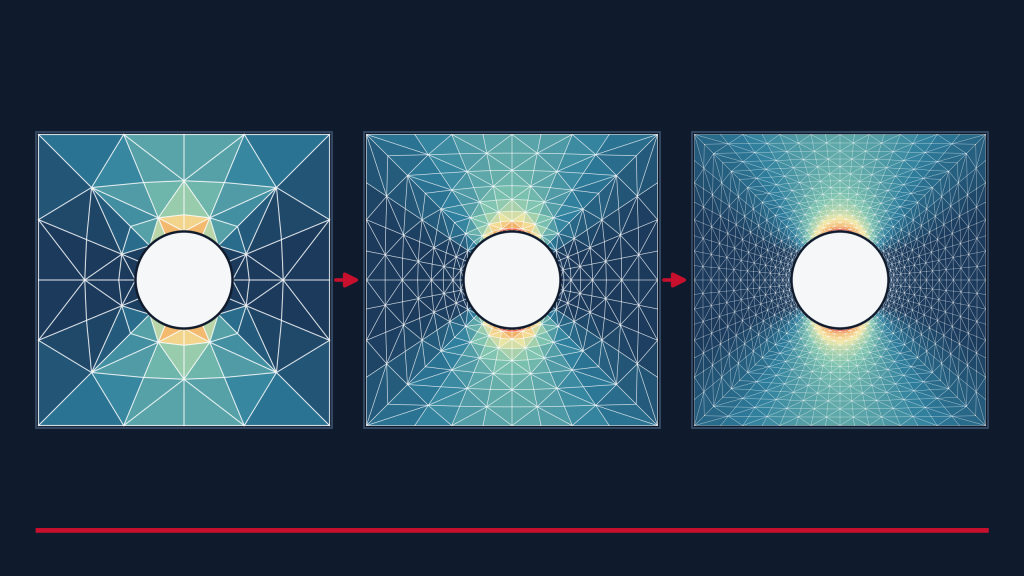
A mesh convergence study runs the same model on a sequence of progressively refined meshes and compares a chosen result between them. Three ideas are often blurred together, and keeping them apart makes the rest of the study easier to defend.
- Mesh independence is the outcome you are looking for: the monitored result changes by less than an agreed tolerance when the mesh is refined further.
- Discretisation error is the difference between the finite element solution and the exact solution of the same mathematical model, caused by representing continuous fields with a finite number of elements. The exact solution is rarely known, so a study estimates how large the error might be rather than measuring it directly.
- Solver or iteration convergence is a separate question: whether the equation solver, or the equilibrium iterations in a nonlinear analysis, reached their tolerances on one particular mesh. A model can satisfy solver tolerances and still be mesh sensitive, and the reverse is also possible. Our guide to linear vs nonlinear FEA covers the solver side.
A mesh-independent result is also only as good as the model underneath it. If the loads, supports or material behaviour are wrong, refining the mesh will converge on a wrong answer more precisely.
Choose the Result That Matters to the Decision
Decide which outputs the engineering decision depends on before building any mesh, and record the location of each. Different outputs converge at different rates, so a study that tracks the wrong one can give false comfort.
- Displacement or deflection suits serviceability limits and stiffness. These usually settle faster than stress, because stress is derived from the gradients of the displacement field.
- Reaction forces help confirm load paths in assemblies and restrained structures.
- Strain energy is a useful global check on overall model behaviour.
- Natural frequencies and buckling load factors matter for dynamic and stability work, and every mode that informs the decision should be tracked.
- Stress matters for strength and fatigue, but it has to be assessed in a way that makes sense. That might be stress at a defined location, a linearised stress along a defined line, or a measure prescribed by the governing code or procedure.
Peak stress near a geometric or boundary-condition singularity needs special treatment, because it may never converge. That is covered below. For now, the practical rule is to write down the quantity, its location and the decision it supports in the study plan.
Plan a Controlled Mesh-Refinement Study
A useful study changes the mesh and nothing else. This sequence works in most structural models.
- State the purpose and the monitored outputs. Include locations and the stress measure to be used.
- Hold everything else constant. Geometry, materials, loads, supports, contact definitions and solver settings should be identical on every mesh. Where possible, apply loads and supports to geometry rather than to individual nodes, so they follow the mesh as it changes.
- Build a sequence of meshes. Two meshes show a difference but not a trend, so three or more are usually needed to judge whether results are settling. Use more when the behaviour is irregular or the decision is sensitive.
- Refine in a consistent way. Record the representative element size and element count for each mesh, and avoid automatic remeshing that silently changes element type, quality or local sizing between runs.
- Choose global or local refinement deliberately. Global quantities such as frequencies and stiffness respond to the whole model, so global refinement is usually appropriate. Local quantities such as stress at a fillet, hole, weld toe or contact edge may justify refining only that region. Check that the transition between fine and coarse zones does not introduce its own error.
- Keep element formulation consistent. Element type and order affect the convergence rate, and some low-order formulations respond too stiffly in bending or with nearly incompressible materials. Check your software documentation, and change formulation only if comparing formulations is the purpose of the study.
The template below can be used to plan and record the study. It is intentionally blank, because representative element sizes, counts and results depend on the model.
| Mesh label | Representative element size | Element count | Monitored output | Relative change from previous mesh | Computational cost | Engineering interpretation |
|---|---|---|---|---|---|---|
| Mesh 1 (coarsest) | ||||||
| Mesh 2 | ||||||
| Mesh 3 | ||||||
| Mesh 4 (finest tested) |
Add rows as needed and use one table per monitored output. Record computational cost as solve time, memory or both, on the same hardware. Use the last column to state, in words, whether the result is still changing, is settling or is stable.
Compare Results and Define an Acceptance Criterion
The usual comparison is the relative change in the monitored result between successive meshes. With Q as the monitored result and i as the mesh number, one common definition is:
\varepsilon_i = \frac{Q_i - Q_{i-1}}{Q_i}Whichever definition you use, state it, apply it consistently and report the sign as well as the size of the change. A result that changes in the same direction on every refinement is behaving differently from one that oscillates around a value.
Plot each monitored output against mesh refinement, using element size or element count on the horizontal axis, and mark the acceptance criterion on the chart. The schematic below shows what to look for. It is illustrative only.
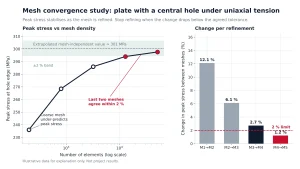
A convergence plot should include:
- Labelled axes with units, and the same mesh order on every chart
- One marker per mesh, so the reader can see how many meshes were run
- The acceptance band or criterion, drawn on the chart
- A clear note where a result is expected to be singular and is plotted separately
- An indication of which mesh was used for the final analysis
Why there is no universal threshold
It is tempting to adopt a fixed figure such as 5 percent and apply it everywhere. No single value is valid for every problem. The tolerance should reflect what the result is used for: how close it sits to its limit, whether the analysis is a screening step or a final verification, and how large the other uncertainties in the model are, such as loads, material properties and boundary conditions. A result with a wide margin can tolerate more discretisation error than one close to its limit. The reviewer needs to justify the criterion for the intended decision, and agree it before the results are seen.
Where three systematically refined meshes behave monotonically, Richardson extrapolation and the grid convergence index (GCI) can estimate the discretisation error. These methods were developed largely for computational fluid dynamics and assume the meshes are in the asymptotic range, so they should be used with care in structural FEA, especially with local refinement or singularities.
Why Maximum Stress May Not Converge
In a linear elastic model, some features have theoretically unbounded stress. The computed peak keeps rising as the mesh is refined, so no mesh gives a converged value. Typical causes are:
- A sharp re-entrant corner with no radius
- A point load applied to a single node
- An idealised restraint that stops abruptly at an edge or node
- Crack tips modelled with ordinary elements
If the peak stress grows with every refinement, suspect a singularity before suspecting the solver. The dashed curve in the schematic shows the pattern.
This does not mean high stresses can be ignored. A high computed stress can point to a genuine stress concentration in the real part. The useful question is what the real feature looks like. Depending on the case, the options include modelling the actual fillet radius or contact patch, assessing stress at a defined location or by a code-defined linearisation or hot-spot method, using displacement, reaction or energy-based measures for the global response, or treating cracks with fracture mechanics parameters instead of peak stress. That last approach is the basis of our fracture mechanics work. If a nonlinear material model is used, plastic strain then needs its own convergence check.
Mesh Convergence vs Physical Validation
A mesh convergence study is one part of numerical verification. It addresses discretisation error. It does not show that the software solves the equations correctly, which is code verification, and it does not show that the model represents the real structure, which is validation against physical evidence. It is also not a compliance certificate. A converged model can still be wrong because of its loads, supports, material data or idealisations.
For structural work, ASME V&V 10 provides a framework that separates these activities. Our article on using NAFEMS standards to validate FEA results covers the wider verification and validation picture in more depth.
What to Include in a Mesh-Convergence Report
A reviewer who was not involved should be able to retrace the study. A useful report records:
- The purpose of the study and the decision it supports
- Model assumptions and idealisations, including loads, supports and material behaviour
- Software, version and solver settings
- Element type, formulation and order
- The mesh sequence, with representative element size, element count and whether refinement was global or local
- The monitored quantities, their locations and the stress measure used
- The results table, including relative change between meshes
- The convergence plots
- The acceptance criterion, who agreed it and why it suits the decision
- Any singularities identified and how they were treated
- Remaining uncertainty and limitations
- The conclusion, including which mesh was adopted for the final analysis and why
- Archived models and mesh settings, so the study can be repeated if the design changes
FAQ
Is a finer mesh always better?
A finer mesh generally reduces discretisation error, but it costs more and does not correct wrong loads, supports or materials. It can also expose a singularity, where the peak stress keeps climbing, and some nonlinear behaviours such as strain localisation are mesh dependent in their own way. The aim is a mesh that is adequate for the decision, not the finest one possible.
How many meshes should be compared?
There is no fixed number. Two meshes show a difference but not a trend, so three or more are usually needed. Use more if results oscillate, if refinement is local, or if the decision is sensitive to the answer.
Why does peak stress increase with refinement?
There are two common reasons. A coarse mesh can under-resolve a real stress concentration, in which case increases should diminish and settle as the mesh improves. Or the location may be a singularity, in which case the increases do not settle. Plotting the result against refinement shows which case applies.
Is mesh convergence the same as nonlinear-solver convergence?
No. Mesh convergence asks whether the result depends on the mesh. Solver convergence asks whether the iterations reached their tolerances on a given mesh. Both need to be satisfied, and neither implies the other. See our guide to linear vs nonlinear FEA.
Discuss Your Model with Avesta
If you want to discuss model credibility, convergence evidence or an independent review of existing FEA, our engineers can help. We support clients through our advanced simulation services and independent design verification. To start a conversation, get in touch with our team.
Related reading: Finite Element Analysis (FEA): A Comprehensive Engineering Guide · Using NAFEMS Standards to Validate FEA Results · Linear vs Nonlinear FEA: Differences and Use Cases