A control system rarely fails in one place. A transmitter drifts, a controller does exactly what it was configured to do, a valve follows its demand a little late, and the process, which has dynamics of its own, amplifies the mismatch until something trips. By the time the alarm summary is printed, instrumentation, electrical and operations have each pointed at a different component, and the evidence that could settle the argument is already being overwritten by the historian, the shift handover and the first repair.
This guide sets out an evidence-first way to investigate that kind of event. It is written for control, reliability, process and maintenance engineers working in power generation, oil and gas, minerals processing, steel and similar plants, and it stays inside the control system: sensor, logic, actuator and the process they act on. For the general investigation framework, including causal factors and action tracking, see our guide to the root cause failure analysis process. Unsure which method fits? See RCA vs RCFA.
Linear troubleshooting checklists assume one broken part. This guide is built around three ideas instead: reconstruct the timeline before you form a theory, test the loop in segments rather than as a black box, and define closure criteria before you declare a fix.
Define the Control System Failure
Start by drawing the boundary. The control system in scope is everything between the process measurement and the process response: the sensor and its process connection, wiring and junction boxes, I/O modules, controller, network, operator interface, alarm system, final control element, and the power and air supplies that keep them working.
Functional Failure, Performance Degradation and Trip
Name the failure type first, because each one points to different evidence.
- Functional failure: the loop cannot perform its function at all, such as a frozen transmitter value or a valve that will not move.
- Performance degradation: the loop works, but badly. It shows as oscillation, sluggish response, offset or rising variability, often chronic until it causes a trip.
- Trip: a protective function acted. Decide early whether it was a genuine demand, a spurious trip, or a correct response to a false signal. That single answer changes where the investigation goes.
Write the failure statement as observable behaviour (“separator inlet shut in on high-high level while the control transmitter showed low level”), not a diagnosis such as “LT-101 failed”.
Safety, Production and Quality Consequences
Rate the consequence before committing effort. Safety or environmental impact, including any demand on a safety instrumented function, justifies the deepest investigation and the widest evidence capture. Production loss justifies a structured, time-boxed one. Quality excursions often point to degraded rather than failed loops, so trend variability, not just trips.
Stabilise the Process and Preserve Evidence
Plant recovery and evidence capture compete for the same people, so agree the order explicitly.
Safe-State Actions and Temporary Controls
Safety comes first, and the goal is a documented safe state, not a fast restart. Then protect the evidence:
- Put affected loops in a known manual state under an approved procedure.
- Record every bypass, override, force and manual mode change, with time and authoriser.
- Do not restart “to see if it clears”, and do not reset controller diagnostics before capture.
Every temporary measure changes the system that failed, so treat the temporary control log as evidence in its own right.
Logs, Trends, Alarms and Configuration Snapshots
Capture the most volatile evidence first. Controller diagnostic buffers and rolling event logs can be overwritten within hours, while a historian may keep data but has already compressed it.
| Evidence | What it tells you | Risk if not captured now |
| Controller diagnostic and event buffers | Faults, watchdog events, mode changes, communication loss | Overwritten by new events or a restart |
| Alarm journal and sequence of events (SOE) record | Order and timing of trips, first-out indication | Rolling retention; alarm floods truncate views |
| Historian data at raw resolution | Real PV, setpoint, output and valve position behaviour | Compression and averaging hide short excursions |
| Running program and configuration upload | Comparison with the last approved baseline | Later edits overwrite the as-failed state |
| Forces, overrides, bypasses, shelved alarms | What protection was actually available | Cleared during recovery |
| Calibration, maintenance and change records | Recent work is a leading suspect | Held on paper or in separate systems |
| Operator logs, HMI screenshots, interview notes | What the operator saw and did | Memory fades; screens are reconfigured |
Photograph terminations before disturbing them, and quarantine any removed device.
Reconstruct the Event Timeline
A timeline turns opinions into testable sequences, and its value depends on time alignment. Controllers, historians, SOE recorders and HMI servers rarely share a clock. Use an event that appears on more than one system, such as a pump start, to measure the offset before interleaving logs, and note each source’s resolution.
First Deviation vs First Alarm
An alarm is a limit crossed, not the moment something went wrong. The first deviation is the earliest point where the measured value, setpoint, controller output and valve position stop behaving as designed. It is usually visible in the historian well before any alarm, and the gap between the two is your detection latency, a finding in its own right.
The illustrative separator example below shows the pattern. Transmitter LT-101 drifts low, so its loop closes the outlet valve and the real level climbs. The first alarm, low level, points the wrong way, and only the independent transmitter LT-102 shows the truth.
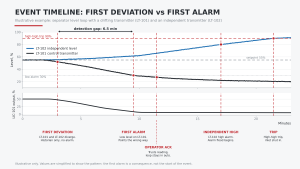
Plot PV, set point, output and valve feedback on one time axis, and compare against any independent measurement.
Operator Actions and Cascade Effects
Treat operator actions as evidence, not fault. Ask what the display showed, which alarms were active or shelved, and what the operator reasonably concluded. An operator who trusted a low-level alarm was following the information the system provided.
Then trace the cascade: how one loop’s output became another’s disturbance, how selectors and overrides switched control, and how a trip in one area removed a feed or utility from another. For wider post-event investigation, see our guide to reactive root cause analysis.
Test the Full Control Loop
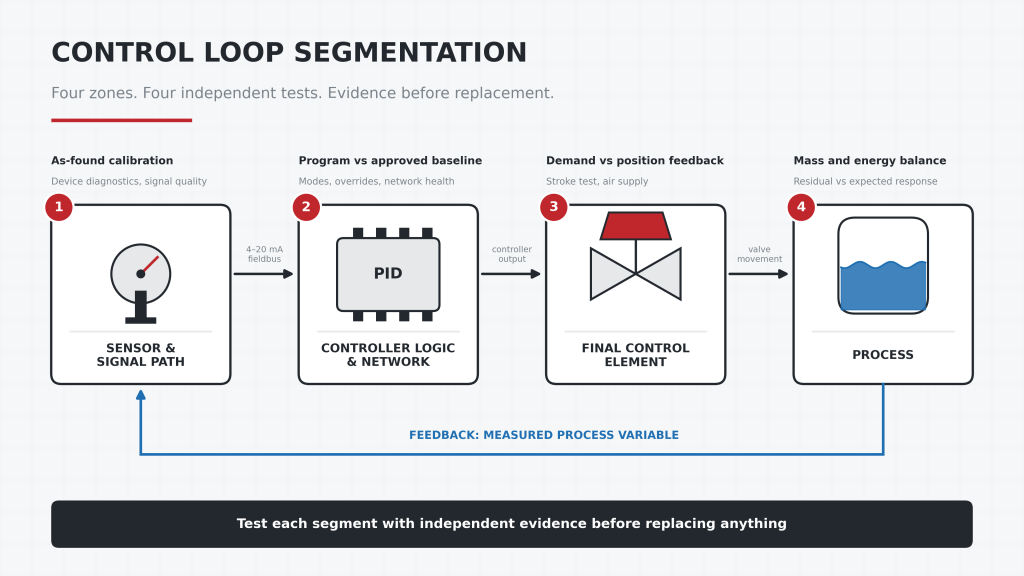
With a timeline in hand, test the loop in the four segments shown in the figure at the top of this article, keeping each test independent. Do not swap parts first: replacing a transmitter before an as-found check erases the evidence of how it was failing.
Sensor and Signal Path
- Process connection: plugged or wet impulse lines, fouled elements, thermowell and installation effects.
- As-found calibration before any adjustment, plus device diagnostics from HART or fieldbus.
- Signal integrity: loop current, noise, shielding and earthing, terminations and I/O channel diagnostics. NAMUR NE43 signals failure below 3.6 mA and above 21 mA, so an out-of-range value is a diagnostic, not a process reading.
- Scaling and units in the transmitter, I/O card and controller. A range mismatch looks like drift.
- Bad-quality handling: what the logic does with a value that is bad, frozen or clamped. Many “sensor failures” are actually unhandled bad-quality states.
Controller Logic, Network and Final Control Element
- Logic and configuration: compare the running program with the approved baseline, then check mode, override, force and tuning states as they stood at the event. Look for output limits, integral windup, scan-time overruns, watchdog events and redundancy switchovers.
- Network and power: line up communication timeouts, packet loss and supply dips (UPS, 24 V DC) against the timeline.
- Final control element: compare demand with actual position feedback, then test stroke time, hysteresis, stiction and air supply. For drives, compare speed reference with actual speed.
A valve that follows demand only after a dead band produces limit cycles that look like a tuning problem.
Fault Isolation Methods
Segment tests tell you where the evidence points. Isolation methods decide which explanations survive.
Cause-and-Effect and Fault Trees
Start with the plant’s cause-and-effect matrix: for the trip that occurred, what should have happened, in what order, and what actually did? Each deviation is a lead. Then build a fault tree with the trip as the top event and close each branch with evidence, never opinion. General fault tree tools are in the RCFA process guide linked earlier; the table below narrows the branches faster.
| Symptom pattern | Most likely segment | First confirming test |
| PV flat-lined while the process is clearly moving | Sensor, signal path or I/O holding a bad value | Compare with independent measurement; check quality flag and loop current |
| PV and output move, valve feedback does not | Final control element, air or power supply | Stroke test; compare demand with position |
| Output saturated at a limit, PV not recovering | Actuator capacity, windup or process outside design | Check limits, anti-windup and process capacity |
| Steady oscillation at a fixed period | Tuning, stiction or loop interaction | Put the loop in manual; if it stops, the cause is inside the loop |
| Several loops disturbed at the same instant | Common supply, network or shared measurement | Check power, network and shared signals at that timestamp |
| Logs look correct, outcome still wrong | Logic, scaling or design intent | Review program against design and cause-and-effect documents |
Model-Based Residuals and Comparative Tests
A residual is the difference between a measurement and what a simple model says it should be. Flow in should equal flow out plus accumulation, valve position should map to flow through its characteristic, and redundant transmitters should agree within tolerance. Residuals turn “it looks odd” into a number with a start time, and often reveal the first deviation earlier than any alarm.
Comparative tests add bench discipline: compare the failed loop with a healthy sister loop, its commissioning records, or a device in its as-found condition. Where the process response is complex, such as fast pressure transients or thermal loads, advanced simulation can test whether a suspected cause explains the recorded behaviour.
Separate Root Cause from Contributing Factors
A root cause is a condition that, had it been absent, would have prevented the event and its recurrence. A contributing factor made the event more likely or more severe but would not have caused it alone. The working test is simple: remove the factor from the timeline, and if the event still occurs, it was contributing. How the physical mechanism relates to wider systemic causes is explored in failure analysis vs root cause analysis.
Hardware, Software and Process Causes
| Cause category | Typical evidence signature |
| Physical (hardware) | Gradual drift in as-found tests, damaged terminations, moisture ingress, worn valve trim |
| Software (logic) | Behaviour repeatable on a simulator; unhandled bad-quality values; incorrect scaling or sequence |
| Configuration and settings | Tuning, alarm limits, ranges or setpoints that differ from the baseline; forced signals |
| Human and procedural | Calibration or bypass errors, unclear procedures, missing authorisation, recent change work |
| Process | Loop operating outside design conditions; disturbance beyond the loop’s capability |
Most events involve several rows. Record them all, then apply the removal test to each.
Common-Mode and Intermittent Failures
Two patterns defeat most investigations. Common-mode failures defeat redundancy by sharing something: one power supply, one cable route, one firmware version, one flawed calibration procedure applied to every transmitter, or one harsh environment. Ask what your “independent” channels have in common.
Intermittent failures show up as trips with “no fault found”: loose or corroded terminals, connector fatigue under vibration, thermal cycling, drive interference, watchdog resets. Add evidence rather than closing the case: log raw signals at high resolution, correlate events with time of day, switching and ambient conditions, and keep “no fault found” open. Where vibration is suspected, vibration and fatigue analysis can show whether the excitation is plausible.
Corrective Action and Proof of Effectiveness
Repair, Logic Change and Management of Change
Rank actions by strength. Stronger actions eliminate the cause by design, add diagnostics or voting, or handle bad-quality values explicitly; retraining alone is weak. Logic or configuration changes should go through management of change, with independent review, testing before download and updated documentation: cause-and-effect matrices, alarm rationalisation under ISA-18.2, and failure-mode records (our RCA and FMEA guide explains how they feed each other).
Where a safety instrumented function is affected, IEC 61511 requires modifications to follow a controlled procedure. If the event exposed a weak safeguard, an independent design verification review can confirm the revised design meets its intended function.
Regression Test, Monitoring and Closure Criteria
Agree closure criteria before the fix goes live. Regression test the changed loop and its neighbours and, where possible, reproduce the original failure offline to show the corrected logic handles it. Then monitor:
- Deviation alarms between redundant or related measurements, so the next drift is caught in minutes rather than after a trip.
- Controller health indicators: time in auto, output saturation and oscillation.
- Valve diagnostics: travel deviation and stroke-time trend.
- The next calibration or proof-test results, compared with the as-found data from this event.
Close the investigation only when the criteria are met and the evidence pack (timeline, tests, configuration comparison, change record) is filed.
Frequently Asked Questions
How do you troubleshoot a control system failure?
Make the process safe, preserve volatile evidence and build a time-aligned timeline before touching hardware. Then test the loop in segments, isolate the cause with symptom patterns and residuals, and confirm it with a repeatable test.
How can you tell if a sensor or controller has failed?
Compare the signal with an independent measurement, then check loop current, device diagnostics and whether controller output and valve feedback respond. A frozen value while the process moves points to the measurement; a correct input with a wrong output points to logic, configuration or tuning.
What data should be preserved after a PLC trip?
Controller diagnostic buffers, the running program and configuration, alarm and SOE records, raw historian data, forces and overrides, calibration and change records, and operator notes. Capture volatile sources first.
What is the difference between root cause and contributing factor?
A root cause, if removed, would have prevented the event and its recurrence. A contributing factor increased the likelihood or severity but would not have caused the event alone.
When to Bring in an Independent Investigation
An internal team is often best placed to run the first pass. Independent analysis adds the most when a safety function was demanded, repeated trips end in “no fault found”, vendors and operators disagree about cause, or a control failure has caused physical damage.
Avesta Consulting’s root cause failure analysis service combines evidence-based investigation with engineering simulation to test whether a proposed cause reproduces the recorded behaviour and its physical consequences, and to review safeguards against their intended function. For an unresolved control-system event, contact us to discuss an independent review.